ImplementedSales Chart / Monthly Totals
 Mark Rosenberg
Staff
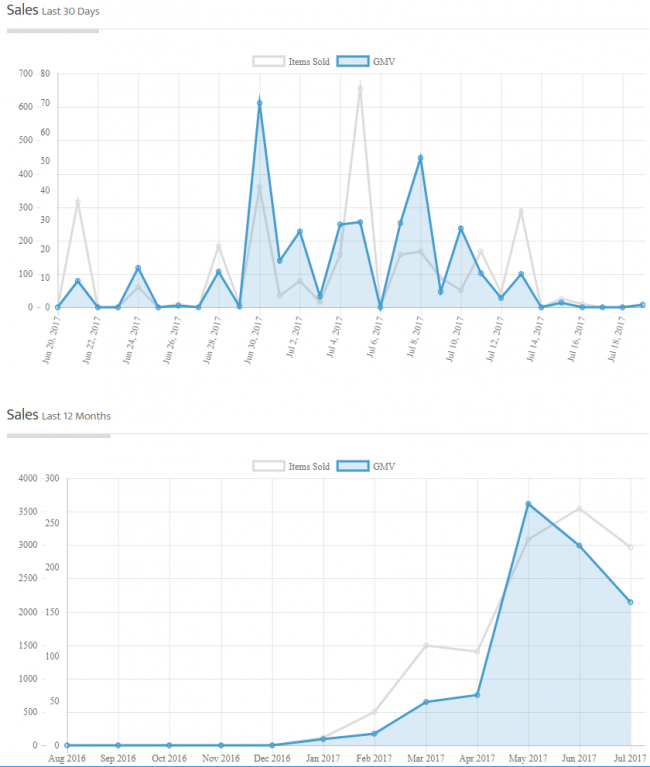
For Sellers, from within the Members Area > Selling section, on the right hand side you can now select "Store Stats", which will display a chart of your sales for the last 30 days, as well well as the last year:
https://www.hipstamp.com/members/selling/stats
For example:

https://www.hipstamp.com/members/selling/stats
For example:


Comments
Okay, I'm going to ask a really stupid question about the charts. What does "GMV" mean? It would help to understand what both lines are representing.
We use the Sales Chart internally as well, and GMV makes more sense for the marketplace as a whole, but to avoid any confusion within the Members Area this should probably just be "Sales Value" (Items Sold is Number of Items Sold). We will update this soon.
Also note if you hover over any dot in the chart you can see the exact values.
Good work and I know you are working hard to make this the best site to buy and sell on. I am going to work hard to make my future months even better than the previous months.
https://www.hipstamp.com/store/michaels-covers